First Symptoms of Apple Scab, Powdrey Mildew and Cedar Apple Rust Infections Visible from 2 May
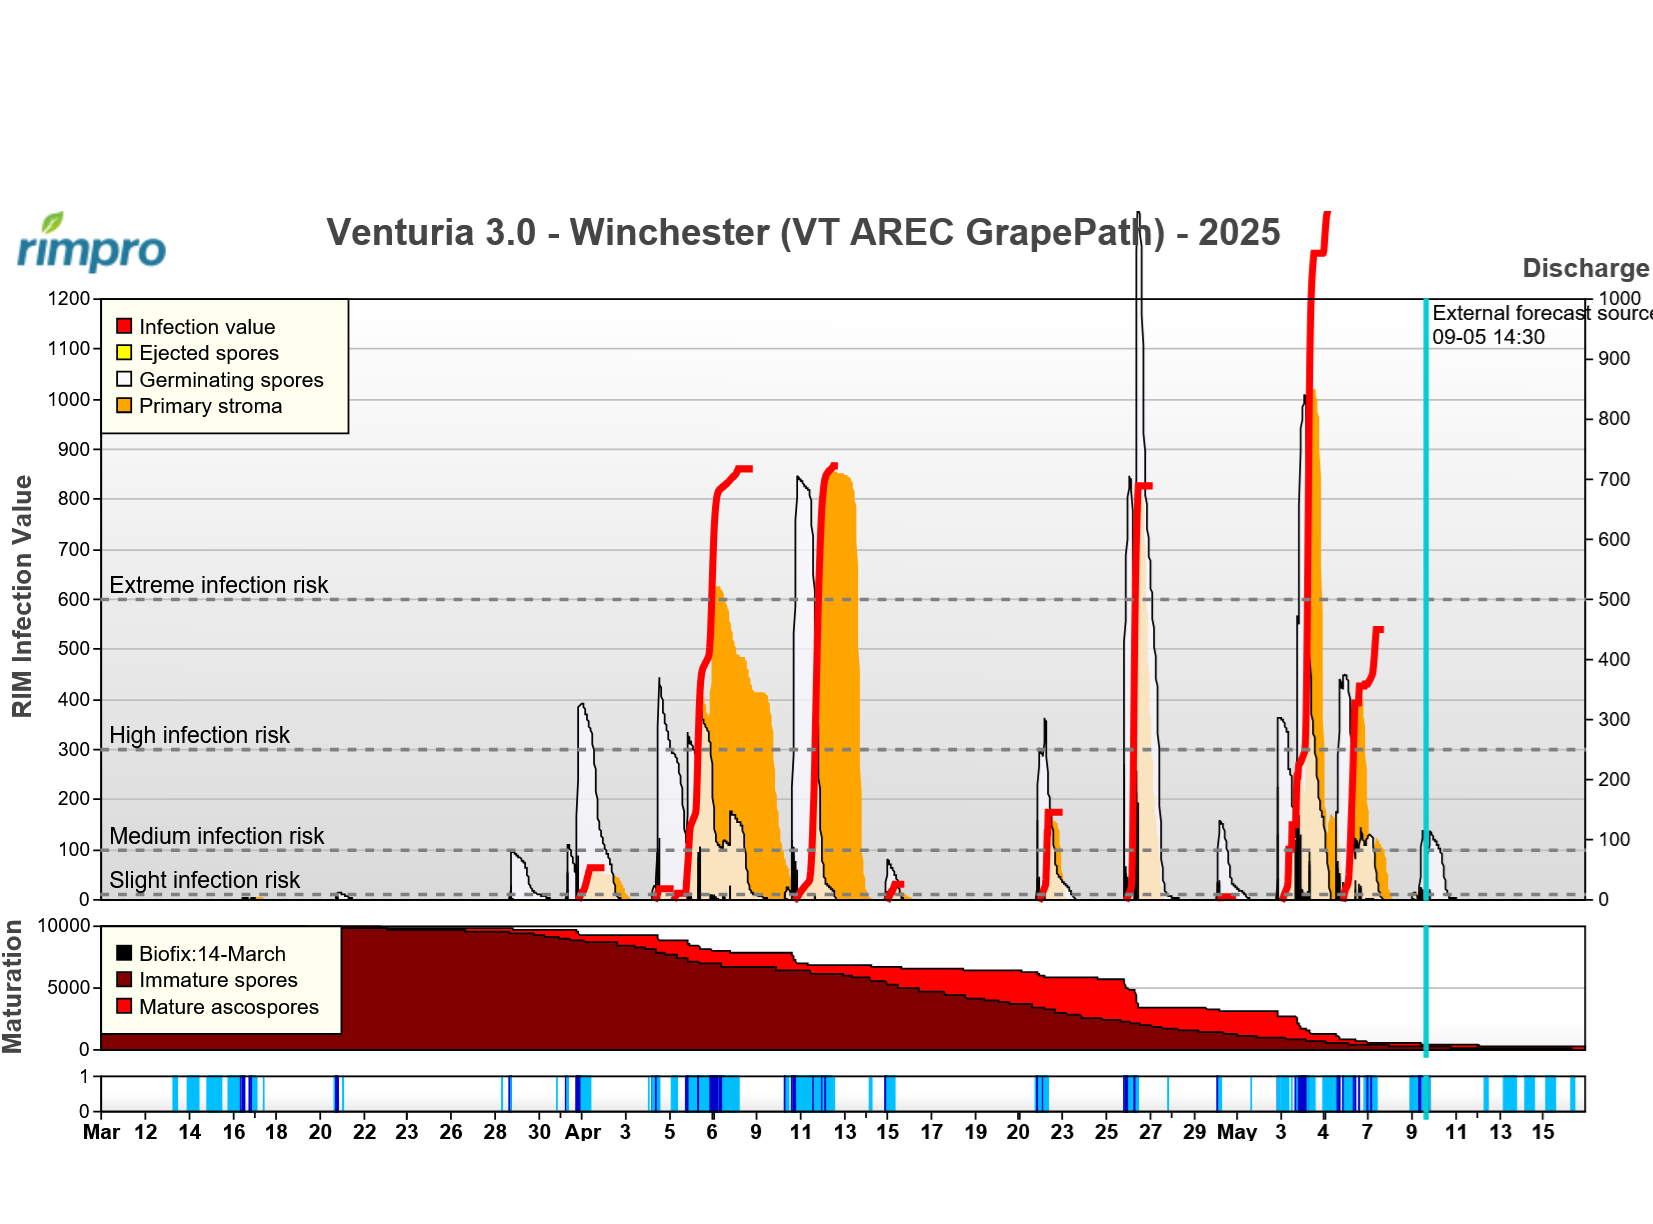
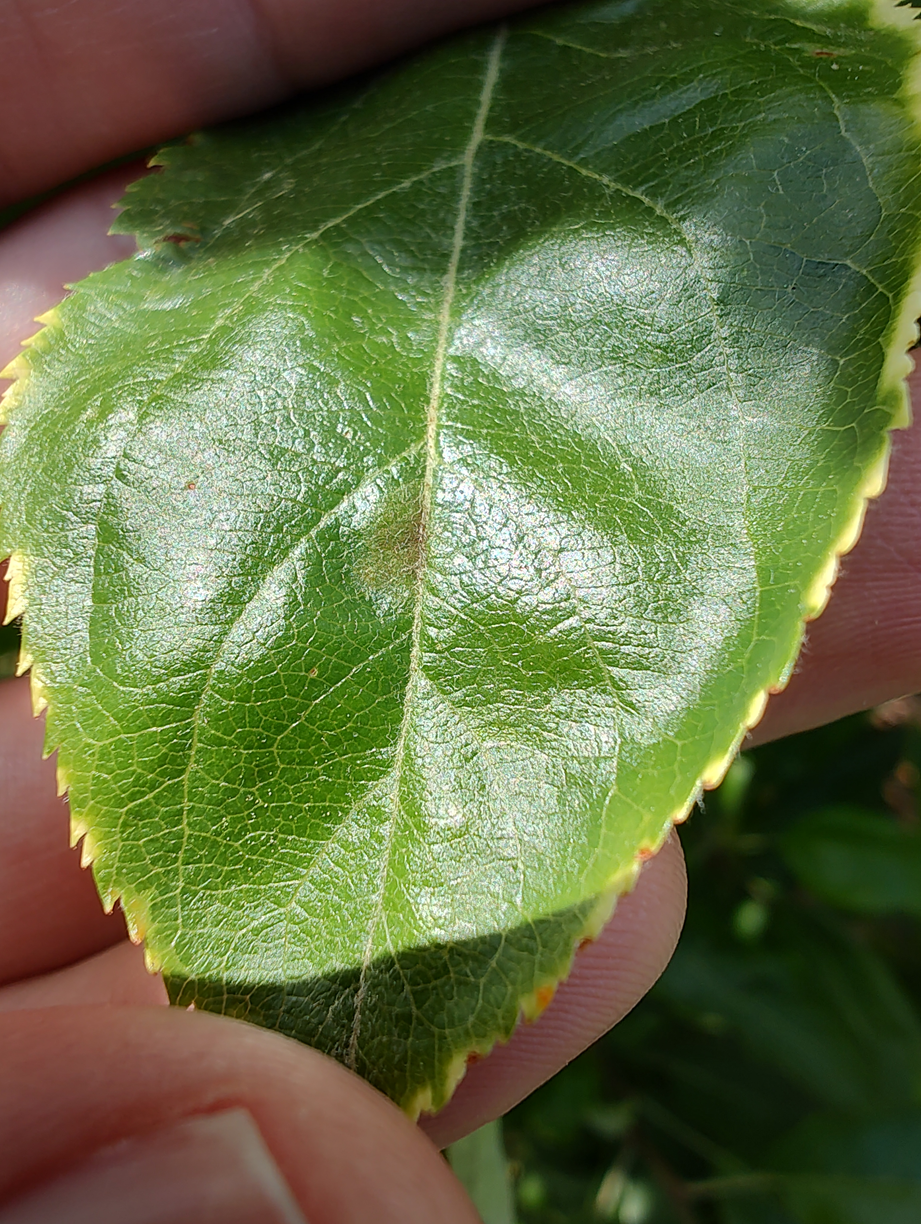
Due to extremely conducive conditions, all the major apple fungal diseases in the Northern Virginia are visible as of 2 May 2025: apple scab (Figs 1, 2), powdery mildew (Fig. 3), and rust (Fig. 4). On 2 May, I found first fresh apple scab infections on ‘Gala’ leaves (Fig. 1, 2) at AREC. These symptoms were found on apple blocks not protected by fungicides. Wet and cold, then wet and warm warm weather in April has quickened the disease symptom occurrence. One of the first impressions when I saw scab visible as dark olive green spots (Fig. 1), was that infections were both on the apple spur and shoot leaves. This means that we had very conducive conditions for apple scab fungus infections when spur leaves were unfolding earlier in April and recently, on shoot leaves. This correlates well with the apple scab RIMpro model reporting that the first major infection of the season occurred on 5 April (Fig. 5).
Figure 1. Primary apple scab infection on ‘Gala’ leaf on shoots (photo by Aćimović S. G. 2025).
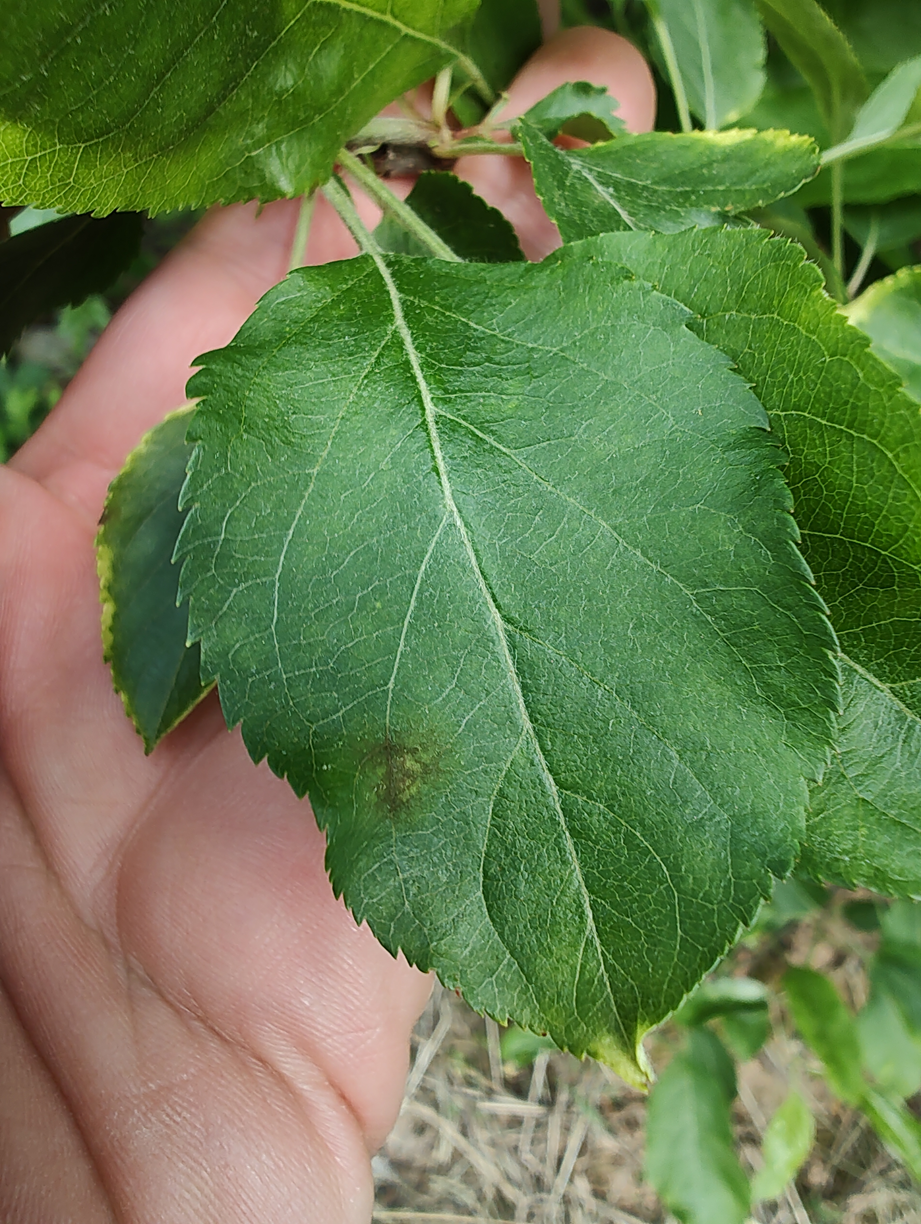
Figure 2. Primary apple scab infection on ‘Gala’ leaf on a spur (photo by Aćimović S. G. 2025).
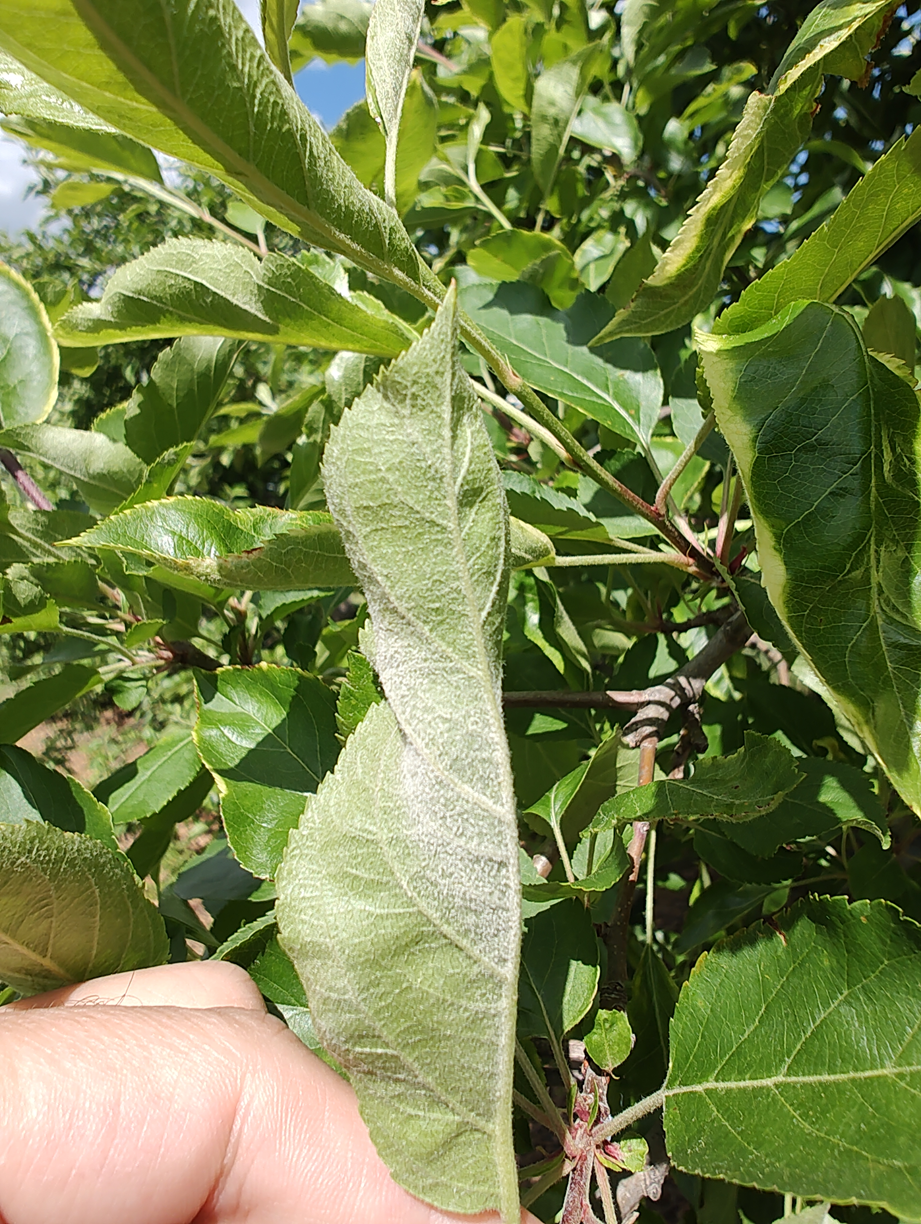
Figure 3. New powdery mildew infection on ‘Gala’ leaf on a shoot (photo by Aćimović S. G. 2025).
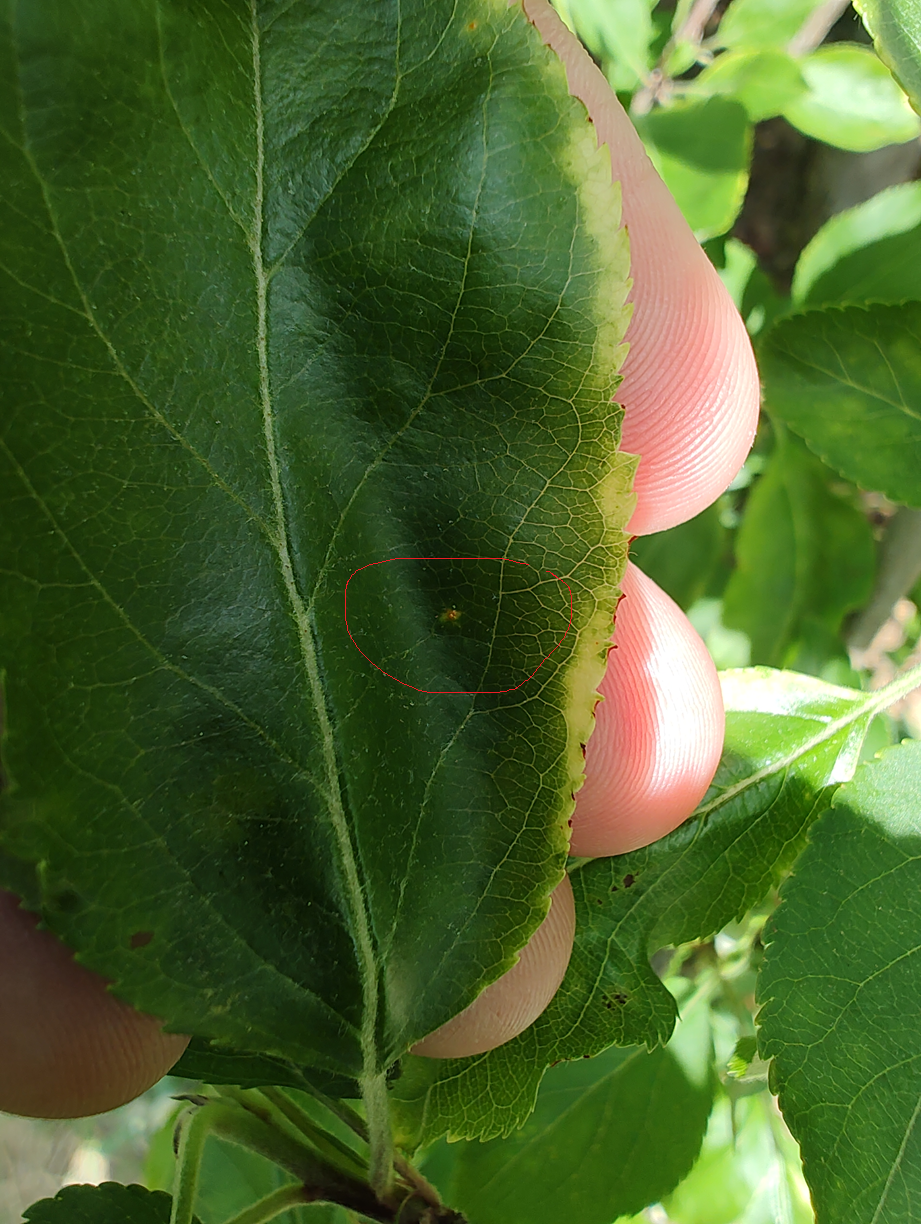
Figure 4. New cedar apple rust infection on ‘Gala’ leaf on a shoot (photo by Aćimović S. G. 2025).Figure 5. RIMpro apple scab model output for 2025 in Winchester, VA (historical data from a weather station). White camel hump-like areas labelled “Germinating spores” show cumulative number of Venturia inaequalis ascospores that germinate over time and are read using the right-side vertical Y-axis scale that is labelled “Discharge”. The red curved lines are scab infections. Read each red curve’s peak RIM infection value(s) using the vertical Y-axis scale on the left-hand side of the graph labelled “RIM Infection Value”. Peak RIM value divided by 100 gives you the percentage of the total season’s ascospores that will cause infection for a given infection period (wetting event). Orange area labeled “Primary stroma” represents scab lesions that were initiated by infection from germinating spores and that are incubating in the leaf after which scab lesions will become visible. This is worth knowing because if no fungicide was applied before the infection started, some or all of the incubating infections can be eliminated by using fungicides with post-infection activity. The light red area in the middle graph labeled “Maturation” is the proportion of mature ascospores that are ready for discharge with wetting events whereas the dark red area shows the proportion of immature ascospores still remaining in leaf litter on the orchard floor. The dark blue bars in the bottom graph showing wetting and dates, are the actual rain periods. The light blue bars are actual wetting periods when no rain is falling but trees are still wet after rain. Courtesy of RIMpro B.V., France.